
Analyze like Wall Street, understand like Main Street.
Analyze your first company for free.
The AI-Powered Value Investing Companion
Stockerowl is your AI-powered financial companion that simplifies Value Investing. We translate complex Wall Street data into clear, easy-to-understand insights.

How Stockerowl Works

1. Multi-Source Data
We aggregate massive datasets from multiple trusted financial sources.

2. AI Analysis
Our trained AI models generate professional-grade, fundamental analysis reports.

3. Clear Insights
We explain the intrinsic value of stocks in plain English, like 'Buying a $100 bill for $70'.
What's Inside a Report?
See exactly how we break down complex financial data into actionable insights.
Company Overview
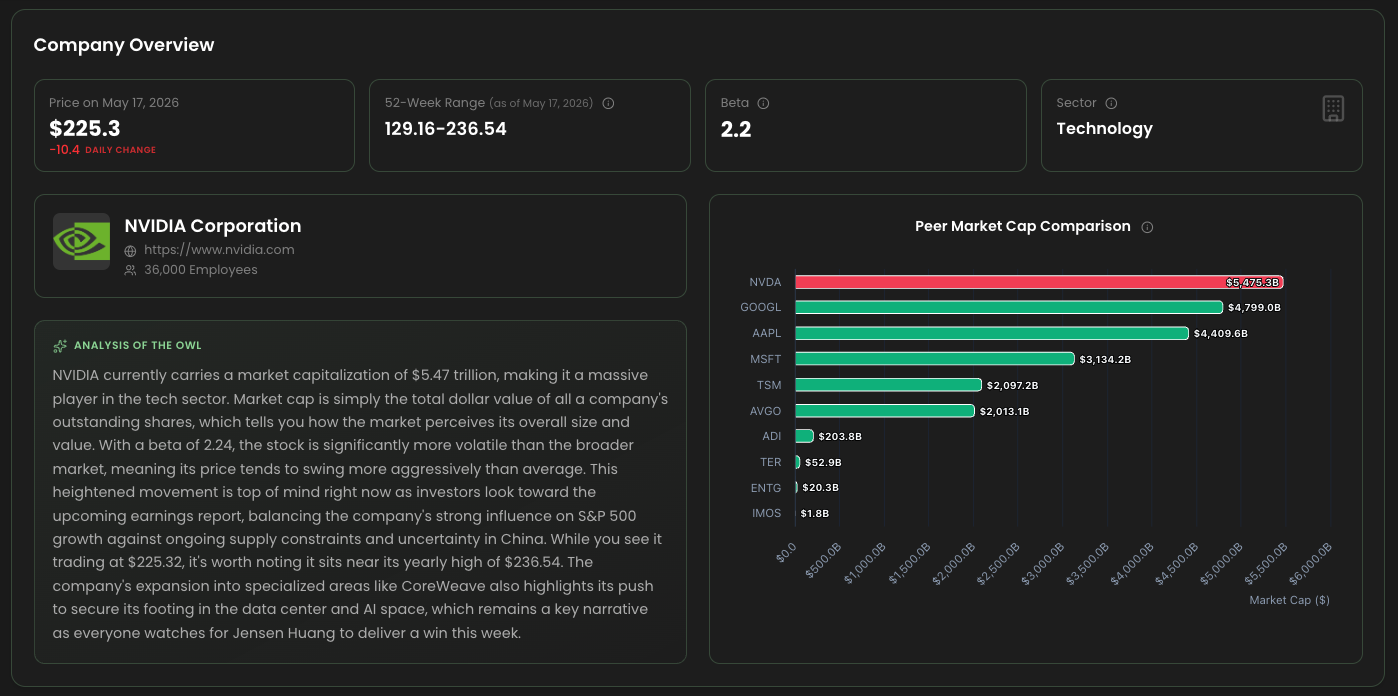
Think of this as the company's dating profile. We tell you exactly what they do, how big they are, and our AI gives you a quick snapshot of their current health. This is your starting point to decide if they're worth a deeper look.
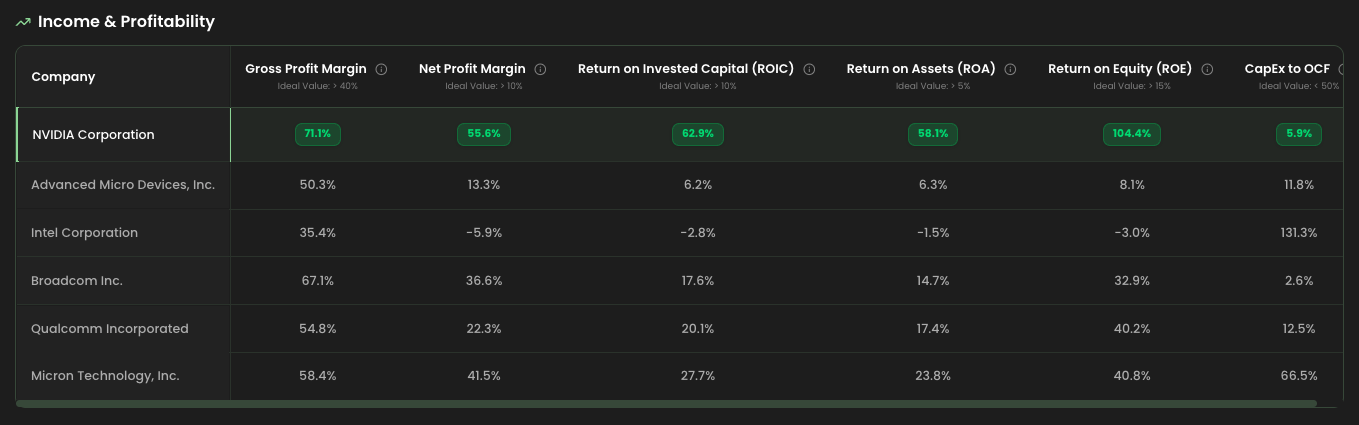
Income & Profitability
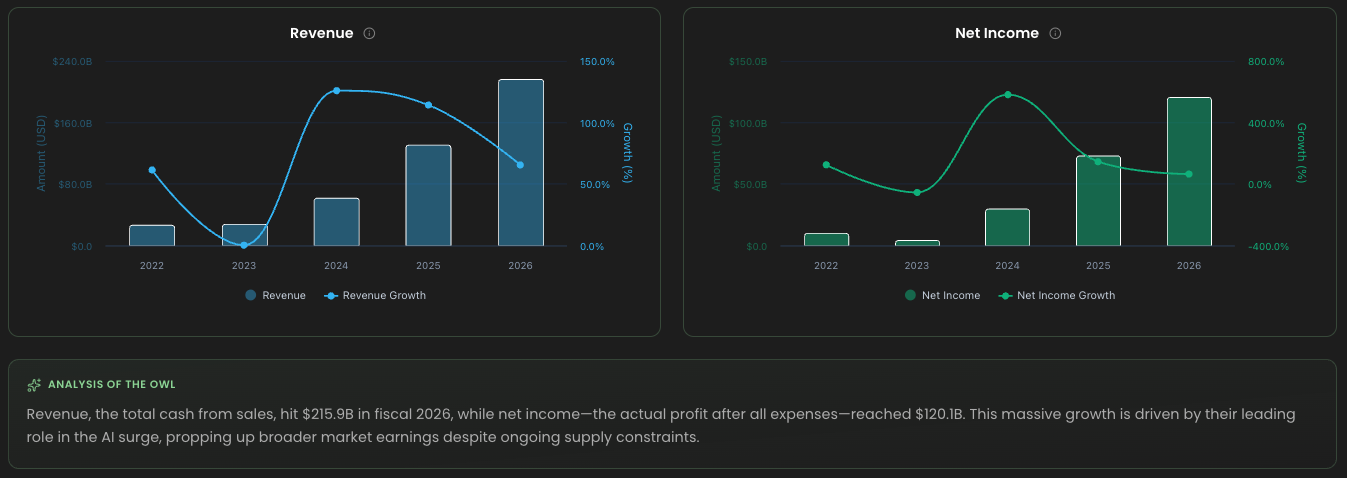
Are they actually making money or just burning cash? We show you their sales and profit trends over time. If you see profits consistently growing, you've found a business that knows how to turn a solid profit.
Balance Sheet
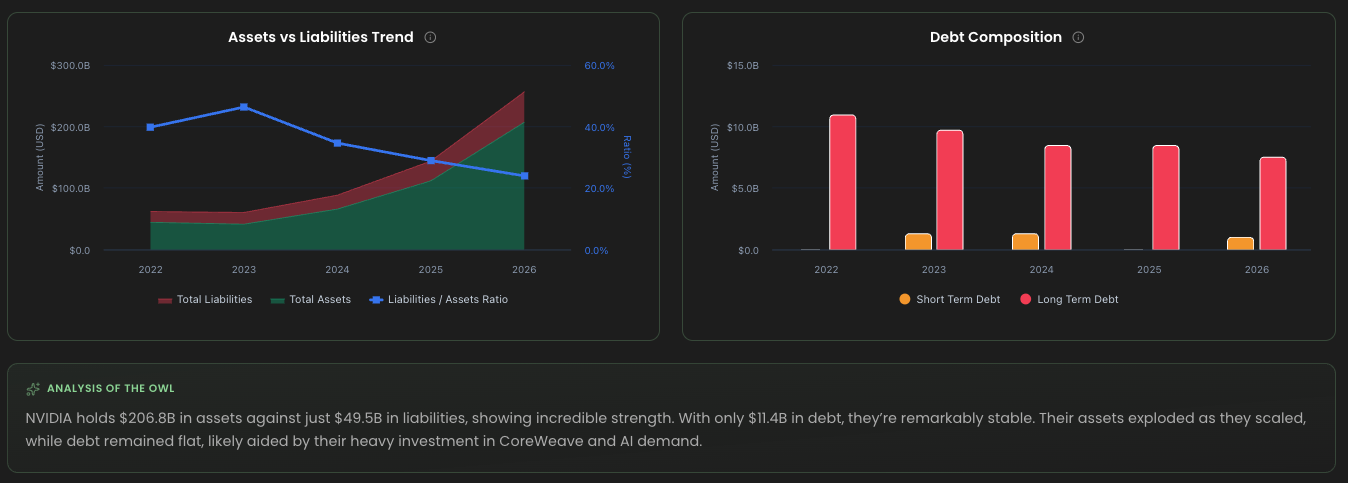
This is their financial report card. We look at what they own versus what they owe. A strong balance sheet means the company can survive tough times without going bankrupt, giving you peace of mind.
Cash Flow
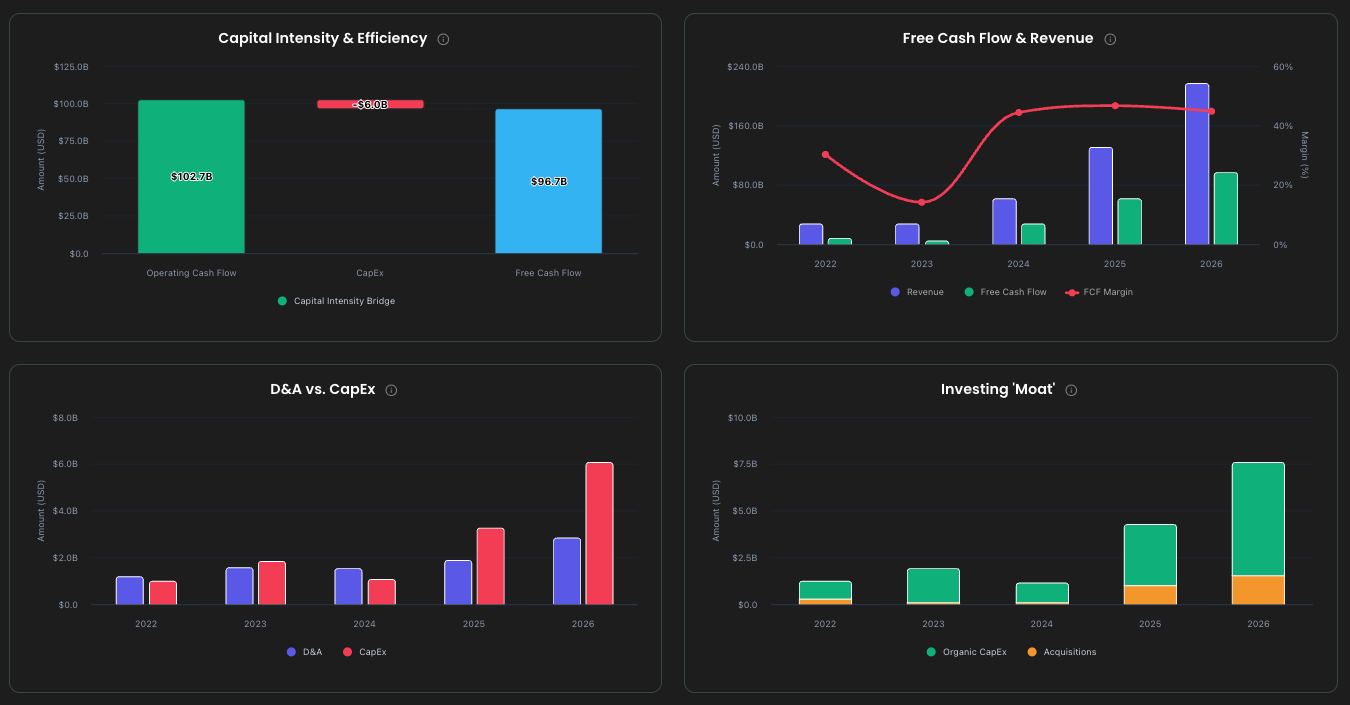
Cash is king! We track the actual money moving in and out of the business, beyond just accounting tricks. If a company generates plenty of extra cash, they can use it to reward you with dividends or reinvest to grow.
Valuation
Is the stock on sale or way too expensive? We compare their price tag to similar companies to help you spot bargains. Understanding this helps you buy great companies at a discount, maximizing your returns.
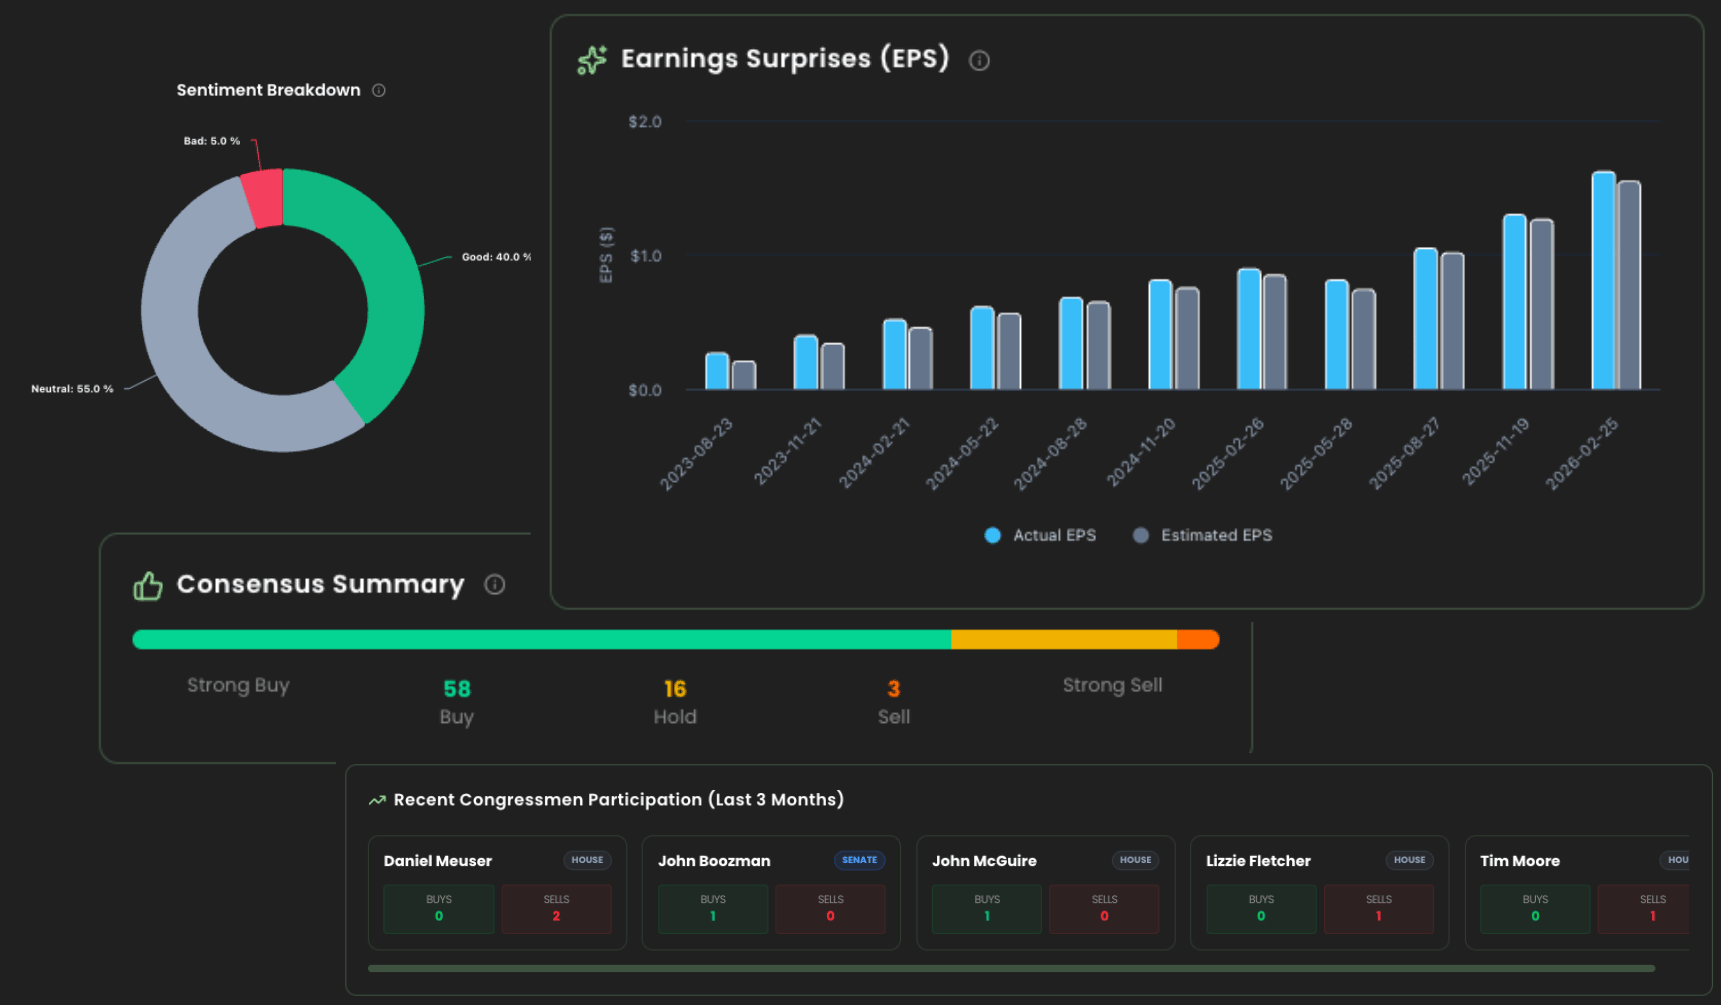
Analyst & Congress Activity
Ever wonder what the insiders are doing? We show you what Wall Street experts predict and whether US politicians are secretly buying or selling. Following the 'smart money' can give you a huge edge.
Full Summary
No time to read everything? Our AI acts as your expert research assistant, tying all these clues together into one simple summary. You'll get a clear, objective breakdown of the company's strengths and weaknesses to help you make your own informed decision.
Supercharge Your Investing with Institutional Tools
Go beyond standard research reports. Interact directly with custom valuation calculators and scan your holdings for potential risks.
Interactive Valuation Sandbox
Don't rely on static, one-time fair value estimates. Our interactive Sandbox lets you play the analyst: easily modify future revenue growth, margins, and interest rates to dynamically recalculate a company's fair value in real time.
- Dynamic Pricing: Tweak assumptions and watch the fair price update instantly.
- Custom Discount Rates: Match the valuation to your personal risk tolerances.
- Interactive Margin Slides: Model optimistic, neutral, or conservative outcomes.
Portfolio Health Scanner
Stop guessing and start optimizing. Scan your entire portfolio to instantly identify hidden financial issues, valuation traps, and diversification gaps. Get actionable, AI-driven rebalancing recommendations tailored to your goals.
- Portfolio-Wide Scans: Gauge consolidated profitability and balance sheet strength.
- AI Rebalancing Advice: Receive direct suggestions to optimize allocation.
- Proactive Risk Alerts: Be notified immediately if a holding's fundamentals decay.
Simple, Transparent Pricing
Free Plan
- Weekly Pick: One new company analyzed every week.
- Access to Public Market Reports.
- 5 on-demand reports per month.
- Interactive Valuation Sandbox on generated reports.
- No support.
Basic Plan
- Weekly Pick: One new company analyzed every week.
- Access to Public Market Reports.
- 50 on-demand reports per month.
- Priority support ticketing system.
- Interactive Valuation Sandbox (What-If calculator).
- Portfolio Health Scanner (Unlimited stocks) & Rebalance Tips.